In this help article you will find the information you need to navigate the Asset Dashboard page of SIERA+.
What does the Dashboard show?
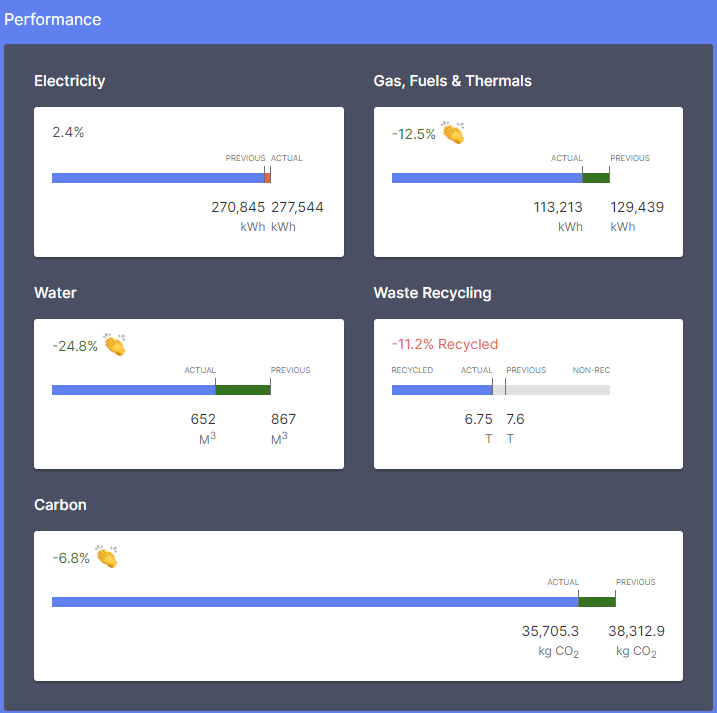
The Dashboard shows you an overview of an asset’s performance.
At a glance a summary of the main SIERA+ features covering recent notifications on Notification, Data Quality, Actions and Performance.
More detail can be seen in each respective page within the app and these can be reached via the tabs or by clicking on the relevant component of the dashboard.
The data on the Dashboard page will be based on the date range set in the date picker at the top of the page. The default date range is Year to Date but otherwise will be what was selected in the page you navigated from.

With this dashboard you can gain a brief snapshot of asset performance and export the page in PDF format in order to print off.
You can return to the Portfolio page by clicking the back arrow in the top left hand corner.
Comments
0 comments
Please sign in to leave a comment.