What does my Fund Performance Dashboard show?
Your Fund Performance Dashboard reveals three key data insights to highlight your progress towards achieving set targets and completing missing data for each asset in each fund.
- Actual and supplier estimated consumption data (Electricity, Gas, Fuels & Thermals, Water, Waste) and total carbon emissions data (scopes 1-3)
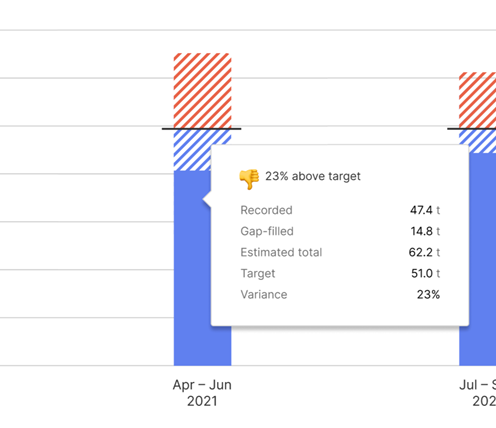
- Gap-filled missing data generated from real data for a comparable previous period (note: this estimated data is less accurate than real data to measure performance)
- Fund performance for a specific timeframe in the current year compared with the same timeframe in the previous year (quarterly or monthly). For set target reductions, performance progress towards achieving that target is shown as a percentage above target or below target and as a numeric indicative cost (estimated overspend or saving)

What is an Estimated Overspend or Saving?
Estimated Overspend or Saving is the difference between your budgeted amount and the actual amount spent or saved. It is always an estimated amount. This is because the amount is based on data available at a specific timepoint and can change when more data becomes available. Fund View uses MWh or m3 target variances to indicate equivalent costs.
What is Target Variance?
Target Variance measures of how much a target/goal is expected to vary from a desired outcome. It helps evaluate the uncertainty or risk of achieving a set target for better planning and decision-making. Target variance can also be used to assess the accuracy or precision of a measurement or prediction.
What does the summary box above the bar chart show?
Your Fund Performance for consumption data (Electricity, Gas, Fuels & Thermals, Water, Waste) and carbon emissions data is summarised as a percentage and numeric change compared with set targets.
If no set targets are in place, a specific timeframe in the current year is compared with the same timeframe in the previous year (quarterly or monthly).

How do I change the timeframe for Fund Performance?
Your Fund Performance date range is set to Year to Date by default (YTD). However, if you toggled to a custom date range on a previous page (see ‘3M, 6M, 1Y’ on top right of page), that custom date range will stay the same when you view Fund Performance. You can also select an alternative date range from one of our predefined options.
Note: If you set a custom date range on your Asset List page and then view a fund on your Fund Performance page, any changes you now make to the custom date range on your Fund Performance page will be applied to all funds and your Asset List page.

What does the Fund Performance bar chart show?
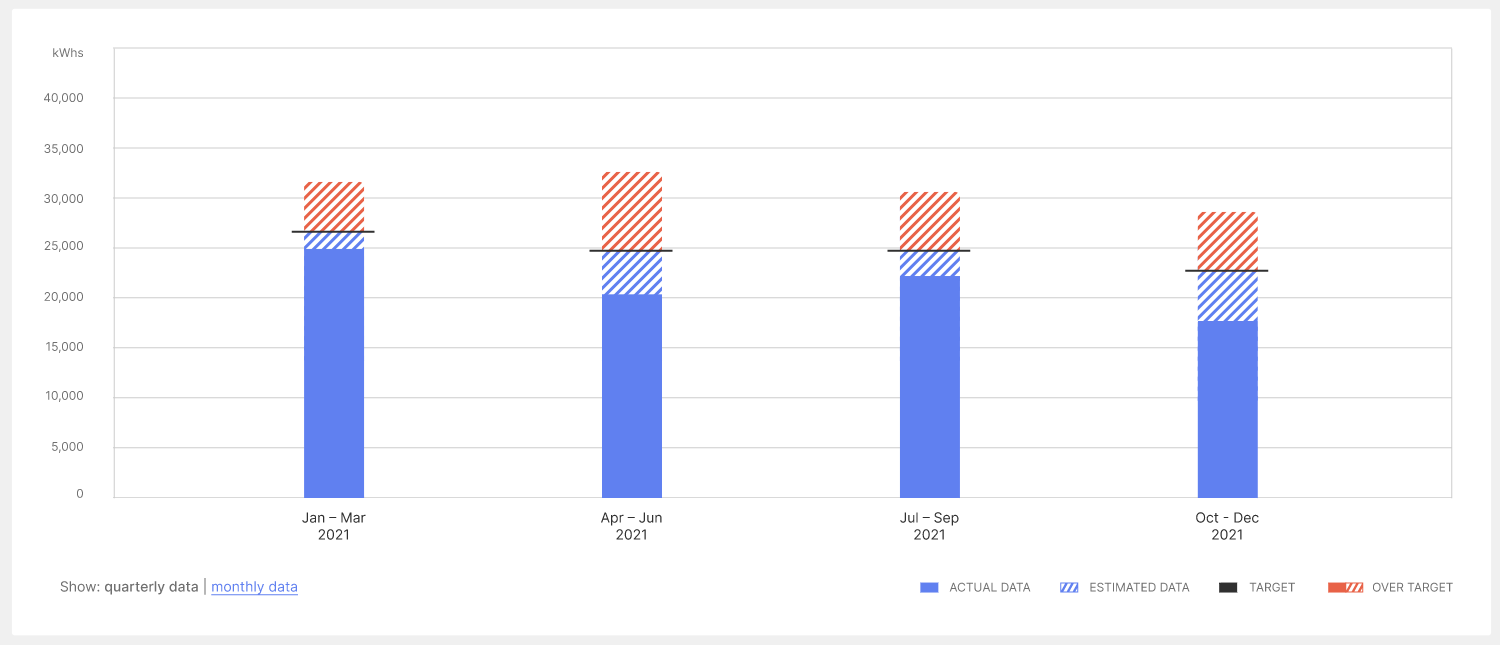
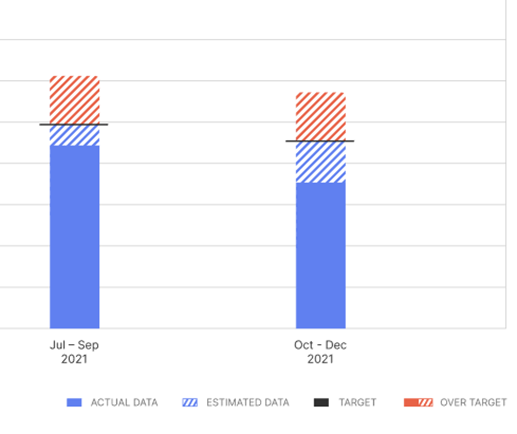
The Fund Performance bar chart displays a quarterly or monthly breakdown for your selected timeframe.
- Fund Performance progress for the current year is shown as on target or above target. Although Fund Performance targets are set annually, the bar chart clearly shows whether your fund is on track to achieve its set target for each month or quarter
- Fund Performance for the previous year is shown as a black horizontal line (or as Fund Performance factored for the targeted reduction compared to the previous year)
- Gap-filled missing data is shown as blue striped lines to generate a more complete quarterly or monthly summary. This also shows whether data gaps have adversely influenced the Fund Performance variance against set targets or selected timeframes


Where can I find individual Asset Performance on the Fund Performance page?
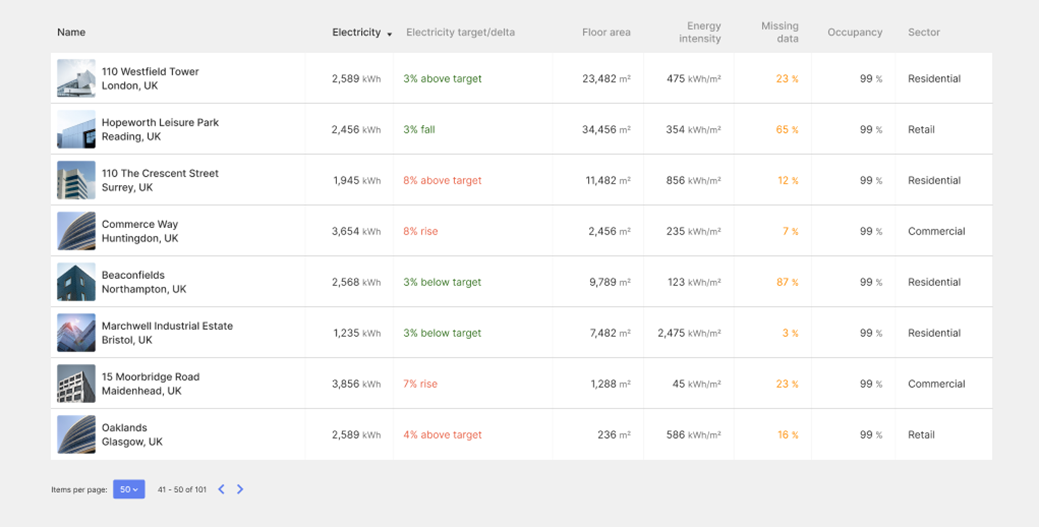
A table listing your assets ranks the performance of each asset against its previous timeframe.
- Green: performance is +5% above target (no action needed)
- Red: performance is -5% below target (urgent action needed)
- Black: performance is +4% to -4% (sits between these values)
Select a specific asset to view its Asset Performance page for deeper insight.

Comments
0 comments
Please sign in to leave a comment.